Mapping Tools
Seeing is believing and geospatial applications are an invaluable resource for visualizing environmental justice communities’ strengths, weaknesses, opportunities, and threats. Here you will find two CEEJH Lab products (the Maryland EJSCREEN and Park Equity Mapper v2.0) in addition to other powerful GIS tools that are being used to analyze place-based EJ issues across the the country.

MD EJSCREEN
The Maryland Environmental Justice Screen Tool (MD EJSCREEN) was developed to allow users to explore layers of environmental justice concern, determine the overall ‘EJ Score’ for census tracts in the state, and view additional context layers relevant to their area of concern or story they would like to tell. The tool is now operational on the ArcGIS online platform, where anyone can access either the Prince George’s County or Baltimore City oriented editions of the tool.
We developed the tool alongside fellow MIAEH professor Dr. Devon Payne-Sturges and our partners at the National Center for Smart Growth and the Maryland Environmental Health Network. Vetting and improvement of the tool in Bladensburg, MD and other Port Towns communities was facilitated by our community partner Port Towns Environmental Action. Additionally the tool has been presented to the Environmental Justice Legislative Team, the Maryland Commission on Environmental Justice and Sustainable Communities (CEJSC), and the Green Funders’ Network.
The tool’s development has been funded by the Town Creek Foundation (via the Maryland Commission on Climate Change) and the Maryland Department of Natural Resources (via NOAA, US Dept. of Commerce Grant/NA17NOS4190153). In 2019, we began working with the University of Maryland Center for Geospatial Information Science (CGIS) to make the following updates to the tool:
sub-layers for park equity, coastal resilience, and food scoring, and
platform improvements to reduce loading and rendering times.

Park Equity Mapper v2.0
We partnered with the Maryland Department of Natural Resources (MD DNR) and University of Maryland Center for Geospatial Information Science (CGIS) to investigate the cultural, socioeconomic, and health barriers to green space access for people of color and low-wealth community members throughout the state. Updating the DNR’s Park Equity Tool, we expanded the classic distance-focused model for measuring access to one that includes public transit and walkability. As we continue to develop this tool, we hope to include factors such as green space quality, climate resilience, functionality, socio-environmental barriers, and more.

CalEnviroScreen 3.0
CalEnviroScreen is a screening tool used to help identify communities disproportionately burdened by multiple sources of pollution and with population characteristics that make them more sensitive to pollution. The tool was developed by the Office of Environmental Health Hazard Assessment on behalf of the California Environmental Protection Agency. Many of the features of CalEnviroScreen gave inspiration to the Maryland EJ Screen
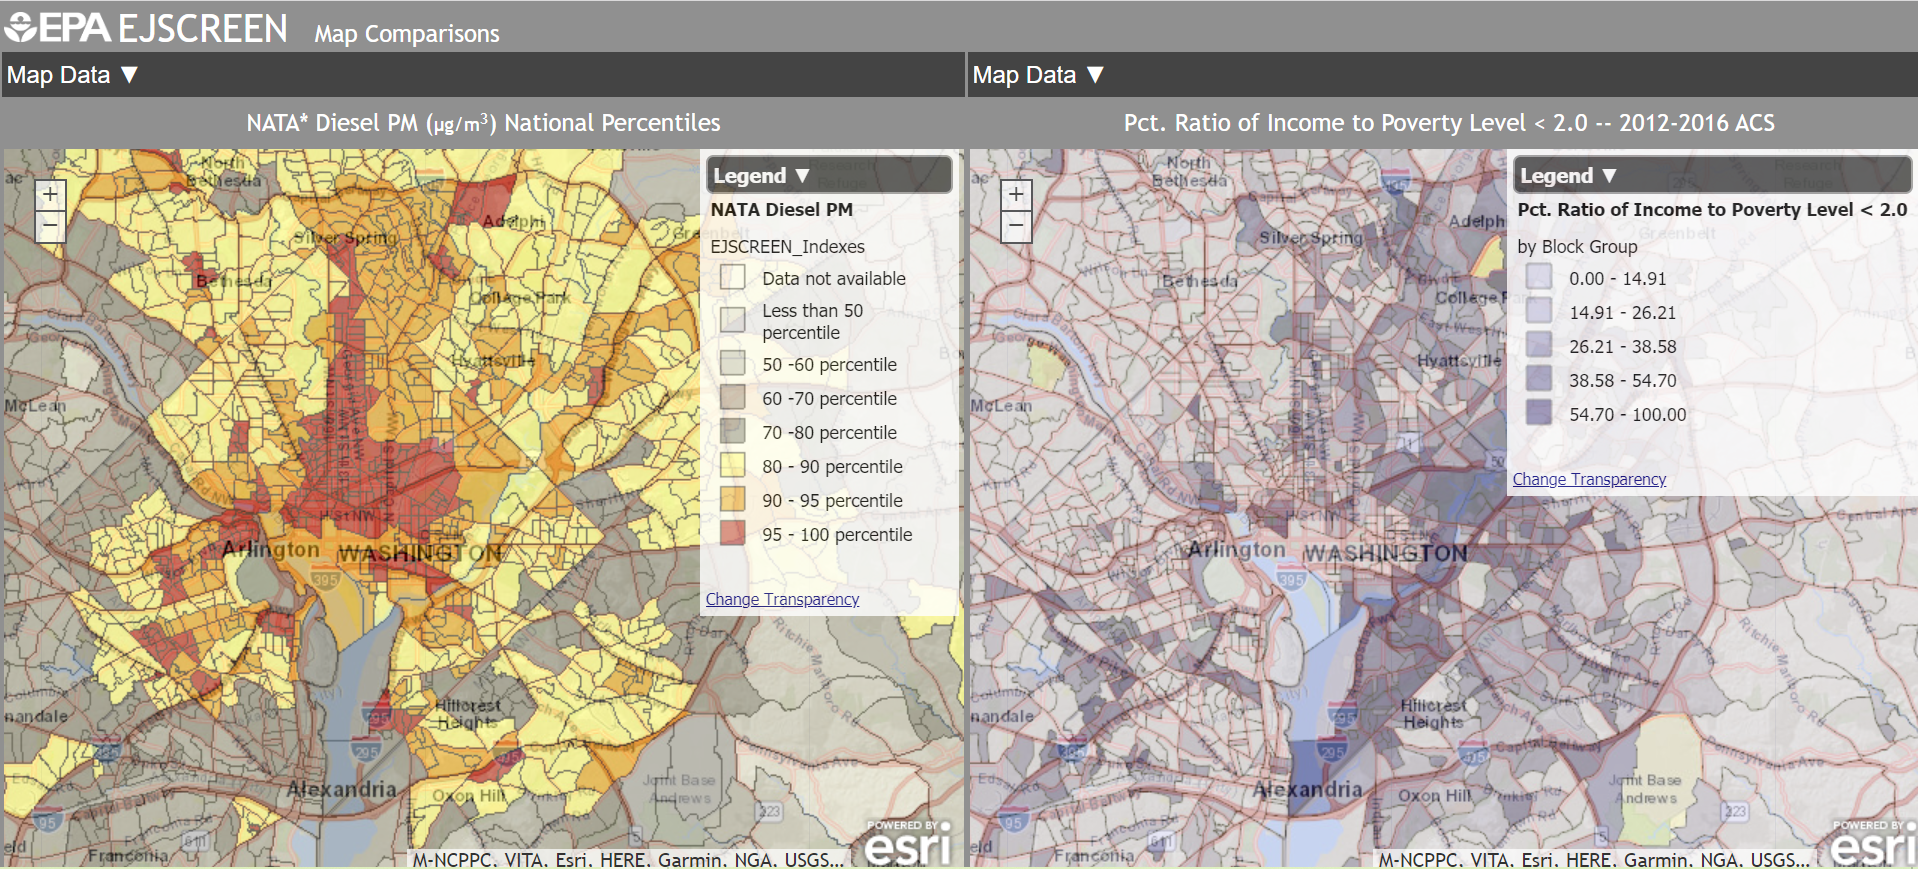
EPA EJSCREEN
EJSCREEN is an environmental justice mapping and screening tool that provides EPA with a nationally consistent dataset and approach for combining environmental and demographic indicators. EJSCREEN users choose a geographic area; the tool then provides demographic and environmental information for that area. All of the EJSCREEN indicators are publicly-available data. (From epa.gov)
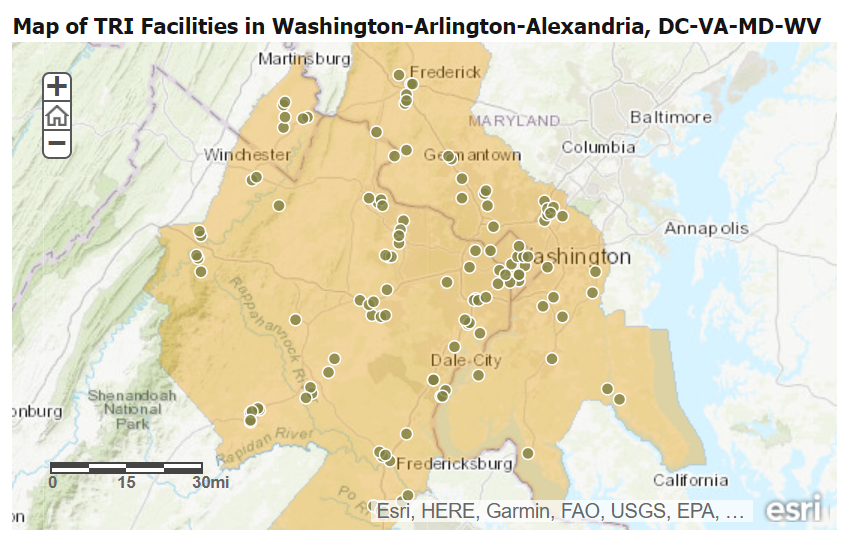
Toxic Release Inventory (TRI) Program
While not strictly a “mapping tool”, the Toxic Release Inventory (TRI) is a resource for learning about toxic chemical releases and pollution prevention activities reported by industrial and federal facilities in your area. TRI data support informed decision-making by communities, government agencies, companies, and others. Section 313 of the Emergency Planning and Community Right-to-Know Act (EPCRA) created the TRI Program. (From epa.gov)