Combating Environmental Injustice: Environmental Benefit Districts (EBDs) as a Solution to Create Just, Equitable, and Sustainable Communities
Contributors: Niya Khanjar, Ashley Deng, Rami Homsi and Summer Khan

Figure 1: U.S. households with children by food security status of adults and children, 2018. (Source: https://www.ers.usda.gov/data-products/ag-and-food-statistics-charting-the-essentials/food-security-and-nutrition-assistance/)
In 2018, 14.3 million US households were deemed as “food insecure”.1 Though the US is the world’s largest economy, over 35 million Americans rely on the Supplemental Nutrition Assistance Program (SNAP) to support themselves and family.2 In 2018, 1 in 7 households with children were food insecure (Figure 1).3 Disparities exist across all populations, but particularly affects those in low income communities of color. Low-income, predominantly African-American neighborhoods have fewer supermarkets, more corner stores and fast food restaurants, and lower availability of healthy foods when compared to higher-income, predominantly white neighborhoods.4-6 Food insecurity occurs when regular eating patterns are disrupted due to lack of resources. The type and number of food stores present is also an important consideration. Often, in regions designated as “food deserts,” fast food restaurants and corner stores outnumber supermarkets.7 In 2019, 17.7% of Americans lived in food deserts. Supermarkets and urban farms are effective ways to provide nutrient dense food to residents.8 Lack of access to nutritious foods has health consequences including increased risk of obesity, heart disease, and diabetes, conditions that are responsible for over 300,000 American deaths a year.1,9

Figure 2: Food deserts are areas where there is a lack of supermarkets and other places to buy fresh, healthy food. These areas are often characterized by high numbers of food pathogens, such as corner stores and fast food restaurants. (Source: https://commons.wikimedia.org/wiki/File:Fastfood.jpg)
Food insecurity, however, is only a single challenge residents of underserved communities face; a number of health disparities these communities face are the result of a disproportionate burden of environmental health hazards located in the community. For example, almost 40% of all abandoned properties are located in just 10% of all census tracts, usually concentrated in metropolitan areas with residents mostly composed of people of color, specifically African Americans or Latinx people.10 In fact, according to a study done by Community Engagement, Environmental Justice and Health (CEEJH) lab, more residents were unemployed, had less than a high school diploma, and had a lower median income in areas that had a Toxic Release Inventory (TRI) facility, which is any location in a covered industry such as utilities or manufacturing that exceeds the established chemical threshold for any of the 767 listed toxic chemicals.11,12 These chemicals have the potential to cause cancer, significant acute human health effects, and significant adverse environmental effects.
Additionally, land that was once used for industrial purposes may end up being contaminated and abandoned in low income neighborhoods.13 Low amounts of private developer interest or a lack of government assistance may result in these lots never being redeveloped leaving these sites to become brownfield or superfund sites, and the contaminants in the land to infiltrate local water supplies further worsening the health of residents. A study in Illinois found that 24 out of 43 communities within close proximity to an environmental hazard had a higher percentage of African Americans and Latinx residents.14 As distance from these hazards increased, the demographics of residents became increasingly White and of higher income.14
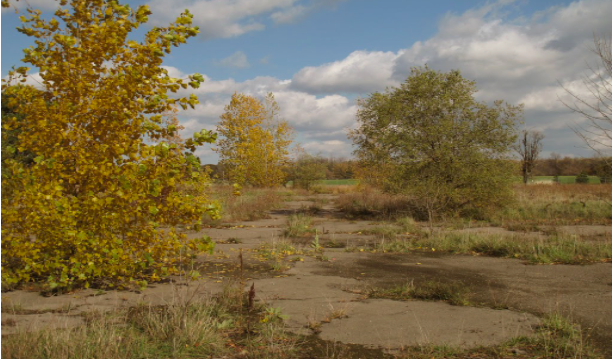
Figure 3: Superfund sites are areas designated by the EPA that cannot be developed because they are contaminated with hazardous waste. Love Canal in New York (pictured above), gained national attention when it was discovered to be a toxic waste dump after residential housing and a school had been built on it. It has since been abandoned. (Source: https://www.flickr.com/photos/rjs-yes/15473594867)
The increase in temperature in urban areas due to a lack of green space is a phenomena called ‘urban heat islands’.15 These heat islands occur when an urban area experiences much higher temperatures than the surrounding rural areas, and can increase daytime temperatures between 1-7 ℉.16 Plants transpire, releasing small amounts of water into the air which cool off the surrounding air, resulting in generally lower temperatures. Because so much concrete, metal, and asphalt is present in urban areas, there are no plants to transpire into the air, allowing it to get much hotter than in rural areas. Additionally, many materials used extensively to build cities in the past were not permeable, such as concrete or brick. A 2008 study found that 60% of most cities are covered by manmade, impermeable material.17 Without water being able to flow through these materials, they could not cool down adequately, causing them to hold heat at much higher rates than soil or other natural land coverings.16 High temperatures resulting from urban heat islands have been associated with respiratory struggles, heat-exhaustion, heat cramps, and nonfatal heatstroke.16 It has been determined that for every 1℃ (1.8℉) there is a 3% increase in those admitted to the hospital with respiratory symptoms.18 In the United States, it is estimated that within 20 years urban residents could be subject to temperatures as high as 127℉.19 A 2020 study suggests that every year, roughly 600 Americans die from heat exposure, and as many as 65,000 seek medical assistance for heat related conditions.20

Figure 5: Temperatures vary greatly depending on what the landscape is made of. Areas of the city that have green space, water, and other vegetation have lower daytime temperatures than areas blanketed by heat absorbing materials such as concrete. (Source: https://www.epa.gov/heatislands/learn-about-heat-islands)
Most urban areas in the United States have histories with redlining, in which racist planning and zoning policies sectioned off areas with high immigrant and POC populations, calling those areas “hazardous for investors” and therefore denying them many necessary resources for a safe and healthy lifestyle. It was found that temperatures in historically redlined neighborhoods were 5 ℉ higher than the surrounding parts of the city, suggesting that inequitable planning and zoning directly contributes to the growing health concern posed by urban heat islands, as shown in Figure 6.20 This is supported by a 2020 New York Times article, which also determined that summertime temperatures can reach 5-20 ℉ higher in historically redlined areas than wealthier, whiter parts of the same city.21 A study published in 2020 found that across the country, 94% of surveyed cities had higher reported temperatures in historically redlined areas, due to lack of green space, high density building materials, and proximity to major roadways.22

Figure 6: A new study found that temperatures in formerly redlined and non-redlined neighborhoods within cities differ by up to 12.6 ℉. (Source: https://www.theguardian.com/society/2020/jan/13/racist-housing-policies-us-deadly-heatwaves-exposure-study#maincontent)
Inequitable zoning and planning is another issue frequently experienced by residents of urban areas.23 This issue occurs when resources and funding are unequally distributed throughout neighborhoods in a city, favoring the more affluent areas and leaving the poorer neighborhoods to suffer.23 Neighborhoods historically made up of people of color, immigrants, and low income residents were disadvantaged by zoning that prevented access to public transportation, affordable housing, and other necessary resources to live a healthy life.24 Lacking infrastructure that allows for a healthy lifestyle has led these neighborhoods to rates of obesity, disease, mortality, and mental illness are higher than surrounding areas. Figures 7 and 8 display the significant overlap between historically redlined areas in San Francisco and areas with high percentages of those suffering from mental illness.25 In recent years, the leading causes of death in the United States have been chronic diseases, including heart disease, cancer, stroke, and diabetes, killing approximately 1.7 million Americans a year.23,26 In the United States, people of color are 1.5-2.0 times more likely to suffer from a chronic disease than White populations, displaying a disparity in health conditions in America.27

Figures 7: The original redlining map of San Francisco, with red areas being those considered “hazardous”.(Source: https://shelterforce.org/2019/07/01/redlining-and-mental-health-connecting-the-dots-across-poverty-place-and-exclusion/)
These chronic conditions have been shown to drastically worsen when a lifestyle of unhealthy eating and inadequate exercise is adopted, which is often the case in low income neighborhoods where space to exercise and access to healthy food is scarce.28 In many of these areas, space that could be used for parks and outdoor recreational facilities is instead taken up by fast food restaurants and other undesirable businesses. There is also evidence to suggest these communities suffer more from urban heat islands than wealthier, Whiter parts of the city. Additionally, these neighborhoods often lack necessary healthcare facilities and supermarkets, further contributing to health inequities.20

Figures 8: The prevalence of mental illness in San Francisco in 2016. This study found a significant overlap in historically redlined areas and high percentages of those suffering from mental illness. (Source: https://shelterforce.org/2019/07/01/redlining-and-mental-health-connecting-the-dots-across-poverty-place-and-exclusion/)
In order to address some of these environmental, social, and economic inequities, the Maryland Department of the Environment (MDE) in 2005 launched a new green infrastructure project known as Environmental Benefit Districts (EBDs). In an EBD, state government, community residents, and other stakeholders direct financial, political, and administrative resources, as well as projects, and initiatives, into communities with the purpose of fostering economic, sustainable, and equitable development.29 By addressing the racial and socioeconomic disparities that perpetuate several of the health hazards discussed such as inequitable zoning and planning, urban heat islands, and food insecurity, EBDs promote the health of residents in underserved communities and reinforce sustainable practices.30

Figure 9: Illustrates the basic premise of salutogenesis by which EBDs are supposed to operate. Pathogenesis is the concept of working retroactively from the disease to determine how to best avoid, manage, and treat the disease.30 In contrast, salutogenesis works proactively in trying to identify and reinforce the factors that improve mental, physical, and social health; this concept of salutogenesis is applied to environmental and community health in the EBD framework rather than just on an individual level like it might be used in medical fields. Thus, the components of EBDs are expressly designed to work in tandem to increase the number of and access to salutogens, factors that improve health, while eliminating pathogens, factors that cause disease, in the community. Salutogens include good housing quality, urban greenways, and access to parks, green spaces, medical facilities, and social service organizations whereas pathogens act as stressors on a community like poverty and crime, lack of medical infrastructure or poor quality roads, landfills, Superfund and brownfield sites, or even just an abundance of fast food restaurants and conveniences stores.23
When pathogens in the community are eliminated, potential causes of disease, such as from environmental hazards, are also eliminated which will reduce risk of developing illness. Likewise, an increase in salutogens will drive equitable development, a method of meeting the needs of those in the community by reducing health disparities and achieving health equity.31 The combination of the doing both will reinforce Just Sustainability in the community as defined by Julian Agyeman; sustainability that improves quality of life, meets the needs of both present and future generations, and provides justice and equity in recognition, process, procedure, and outcome.32
EBDs are an initiative exclusive to Maryland, but the components of EBDs that are meant to holistically address the disparities underserved communities face have been tested nationwide. For example, an important component of EBDs are Economic Enterprise Zones (EEZs) which are targeted areas where the government uses tax incentives and grants to stimulate job creation and economic rejuvenation. EEZs have the potential to prevent industries with poor environmental impacts and poor health impacts to obtain permits, to revitalize the process of brownfield rehabilitation, and to promote industries with zero net emissions. Another important component of EBDs is the principle of smart growth which prioritizes efficient use of land that has been previously developed, thereby strengthening already existing businesses and institutions. Additional measures of smart growth such as mixed income housing, compact building design, walkable neighborhoods, and preservation of green space all work to foster a sense of community which have the potential to diversify neighborhoods with the hopes of helping undo the decades of redlining policies that have segregated communities.33
Health Enterprise Zones (HEZs) are designated areas with poor health outcomes contributing to racial, ethnic, and geographic disparities, but are small enough to allow incentives to have measurable impacts. HEZs aim to improve certain community health determinants such as healthcare provider shortages, cultural competency, and economic revitalization.34 HEZs, in particular, have had enormous success in Maryland; between 2013 and 2018, HEZs achieved a reduction of 18000+ inpatient visits and roughly $93 million in health care costs by focusing on preventative health care.35 The final component of EBDs that comprises the green infrastructure project is equitable zoning and planning policy in order to engage underserved communities in the smart growth model through clear initiatives and collaborative problem solving which allow vulnerable populations to exert greater control in the development of sustainable community practices.23
The largest challenge involving EBDs is the fact that the MDE, since the launch of the project in 2005, has not released any information regarding the success of the EBDs in Maryland resulting in difficulties measuring the impact of the project and slowing progress on improving the project if need be. If the MDE were to start tracking the impacts of the implemented EBDs in Maryland, we would recommend the usage of The World Health Organization’s Health Equity Assessment and Response Tool which gives comprehensive technical guidance that includes several key indicators of outcome measurements that fit nicely within the framework of the EBD and the social, environmental, ecological, economic, and health (SEEEH) variables.36 The WHO’s tool provides 12 indicators that could be used to track the impact of EBDs over the course of implementation.36

Figure 10: The World Health Organization’s 12 indicators used to track EBD impact following implementation. (Source: https://apps.who.int/iris/bitstream/handle/10665/79060/9789241500142_eng.pdf?sequence=1&isAllowed=y)
EBDs however are only a single method of minimizing the negative impacts that accompany the environmental health disparities underserved communities face. Initiatives that are similar in principle to EBDs have been implemented across the country as an attempt to combat the issues stated above. The first is the ReGenesis Project located in Spartanburg, South Carolina.37 The project was initiated in 1998 as a response to disproportionately high rates of disease and other serious health risks recorded in nearby communities. Residents were exposed to dangerous levels of environmental contaminants because of the close proximity of hazards such as Superfund sites and TRI facilities. Stakeholders on the project created partnerships with over 124 organizations, both federal and state, to achieve the following goals: environmental justice, equitable development, and protection of public health and the environment.
Between 2000 and 2010, the ReGenesis Project obtained over $250 million in funding and had successfully completed the cleanup of two Superfund sites, built 500 new housing units, and raised hundreds of thousands of dollars of per capita income raised from the jobs created.38 Additionally, the project strengthened community-government relationships that were built throughout the project, which restored residents’ trust in their local authorities to care for their neighborhoods and health. Overall, the ReGenesis Project is considered a success, and set the precedent for several similar projects around the country.39

Figure 11 displays an example of a neighborhood of affordable housing units developed during the ReGenesis Project. Figure 12 shows ReGenesis founder Harold Mitchell Jr. (second from right), with several community leaders who were also involved in the project. (Source: http://greenimpactzone.org/About/index.aspx)
A similar initiative was proposed in 2009 in Kansas City, Missouri. This project, called the Green Impact Zone, designated a 150 square block area of the city suffering from high percent of vacant lots, nearly 50% unemployment rate, less than 50% home occupation rate, struggling businesses, aging infrastructure, and low home value to be the recipient of green investment.40 Goals of the Green Impact Zone were increasing community engagement activities, creating housing improvement programs, developing sustainable energy programs, creating projects for home weatherization, and implementing economic development strategies.41
During the first two years of its implementation, the Green Impact Zone secured $26.2 million for the development of transportation infrastructure improvements, and undertook an intensive weatherization initiative that included weatherization work on 115 homes.42 By 2012, the project had undertaken an affordable housing project that transformed a vacant school building into 50 new housing units and developed a program called ‘Second Mortgage Loan Program’, making it easier for individuals to purchase their first home.43 Additionally, the project had leveraged more than $178 million worth of investments for use in housing rehabilitation, sustainable development projects, weatherization, and leadership/employment training.42 Data since 2013 has been unavailable, as the Green Impact Zone office has officially closed.
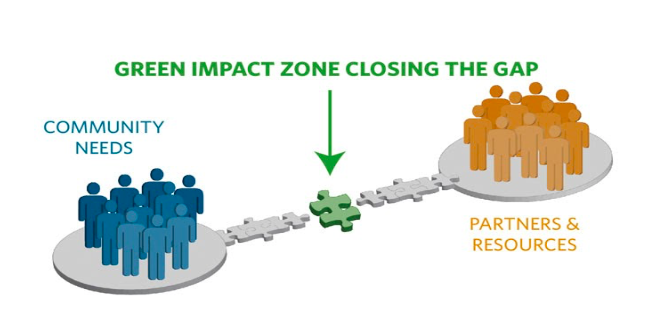
Figure 13: Displaying the goal of the Green Impact Zone project to increase community engagement and fill the gap between residents and those providing the resources. (Source: http://www.greenimpactzone.org/model.html)

Figure 14: Sidewalk renovation was one of the many upgrades to Kansas City made in the Green Impact Zone. (Source: https://calgreenzones.org/wp-content/uploads/2018/08/CEJA-GREEN-ZONES-2018-UPDATE-w-2018-Cover.pdf)
The third exemplar in the United States are the Green Zones in California, facilitated by the California Environmental Justice Alliance (CEJA), and launched in 2010.43 Similarly to Spartanburg and Kansas City, areas are designated to be Green Zones when they are overburdened by environmental hazards, ultimately affecting the health and wellbeing of residents. Across the state, there are eight neighborhoods designated as Green Zones, each with its own specific goals to accomplish. However, there are general goals of the project as well: creating and implementing strong environmental protection policies, direct public and private funding to aid these communities in need, and most importantly, encouraging community-based solutions.44
One of the biggest accomplishments of this project was the implementation of Green Zone bill SB1000 into California law in 2016, which requires environmental justice to be a consideration in local land use planning.43 The following year, permits for two 100 percent affordable housing projects were approved: a 94-unit building for seniors and a 127-unit family housing building. Also in 2017, San Francisco opened the first new public park in 10 years under the supervision of CEJA and the Green Zone project, while the community in San Bernardino successfully removed tanks storing over 600 gallons of liquified natural gas from next to an elementary school and neighborhood, sparing those residents the health concerns of frequent leaks and spills. In 2018 alone, the Green Zone project distributed $141.6 million to designated Green Zones across the state to support their mission to environmental justice.43 These successes are just examples of positive changes the Green Zone project and CEJA have made to the state of California. The project continues to benefit these communities every year, and bring the state closer to environmental justice.

Figures 15

Figure 16
Both Figures 15 and 16 display community members coming together to facilitate projects introduced by the Green Zone initiative in California. The initiative emphasizes the importance of community involvement. (Source: https://www.facebook.com/CaliforniaEnvironmentalJusticeAlliance/photos)
The EBD project here in Maryland, the ReGenesis Project in South Carolina, the Green Impact Zones in Kansas, and Green Zones in California all have minor differences between them that makes each project distinct from one another. However, the general concept behind them, that equitable development and just sustainability are needed to alleviate the burden that underserved communities experience from disparities in health, remains the same. If a local or state government is planning on a similar initiative or any other type of policy to address the inequities that underserved communities face, then a few of the following recommendations may be of assistance.7, 45
Develop working groups to examine environmental justice concerns of local residents
Require town hall meetings to inform local residents and businesses about any major decisions and to engage with stakeholders of concern
Implement equitable transit-oriented development to lower housing and transportation costs, while working with community-based organizations to design more accessible, efficient, and safe transportation infrastructure
Update land use policies to include equitable development principles
Use tools such as housing trust funds, Low-Income Housing Tax Credits, and rehabilitation assistance to maintain access to opportunities and expand housing choices for low-income families
Use the EPA EJSCREEN tool to target communities for vitalization or revitalization investments following the equitable development framework including community development block grants, HUD funding, TIF funding, HEZ funding, etc.
Use the WHO and NAACP suggested indicators for inequity to designate areas to target with the policy or initiative. Key demographics within the location, such as age, ability and linguistic status are recommended to be used within site selection
The design of the initiative should be focused on the health and economic potential of the project. This could include introducing more sustainable sources of energy, improving public and active transportation, recruiting health focused restaurants or locally sourced food outlets, and transforming
Unincorporated communities could reach out to non-profit organizations to apply for funding in order to increase access to transit, food, and other resources
Allocation of funding should be performed in a transparent manner and funding, along with expenditures should be monitored in an effort to address equity concerns
Auditing of allocations and records of expenditures could be of use for future initiatives and projects to evaluate funding mechanisms and costs
Use of metrics to track the impact of built environment and green infrastructure improvements in improving health outcomes
References
“USDA ERS - Snap Web Table.” n.d. Accessed August 24, 2020 from https://fns-prod.azureedge.net/sites/default/files/resource-files/SNAPsummary-7.pdf
“Environmental Justice Plan 2025.” 2018. Accessed August 24, 2020 from http://www.btbcoalition.org/index%20page%20images/ENVIRONMENTAL%20JUSTICE%20PLAN%202025_PrinceGeorges.pdf
Shargo, Isabel, Sacoby Wilson, Jonathan Hall, Ashley Deng, Niya Khanjar, Camryn Edwards, Isabelle Berman, and Joseph Galarraga. 2020. “Proximity of Urban Farms to Contaminated Sites in Baltimore, Maryland.” Unpublished.
Akbari, Hashem, and Leanna S. Rose. 2008. “Urban Surfaces and Heat Island Mitigation Potentials.” Journal of the Human-Environment System. Accessed August 26, 2020. https://doi.org/10.1618/jhes.11.85.
Maantay, Juliana. 2001. “Zoning, Equity, and Public Health.” American Journal of Public Health, 91(7), 1033-1041. https://ajph.aphapublications.org/doi/pdf/10.2105/AJPH.91.7.1033
Agyeman, Julian. 2013. Introducing just sustainabilities: Policy, planning, and practice. London, UK: Zed Books.
Association of State and Territorial Health Officials. 2014. “National Partnership for Action to End Health Disparities.” Accessed August 24, 2020 from https://www.astho.org/health-equity/md-health-enterprise-zone-story/
“World Health Association.” 2010. “Urban Health Equity Assessment and Response Tool.” Accessed August 24, 2020 from https://apps.who.int/iris/bitstream/handle/10665/79060/9789241500142_eng.pdf?sequence=1&isAllowed=y
“BACK STORY | REGENESIS.” n.d. Accessed August 26, 2020. http://rcdc.us/back-story/.
“Green Impact Zone of Missouri Year One Annual Report.” 2010. Accessed August 24, 2020 from http://greenimpactzone.org/assets/annual-report-09-30-10.pdf
“Green Impact Zone of Missouri Year Two Annual Report.” 2011. Accessed August 24, 2020 from http://greenimpactzone.org/assets/2011annualreport.pdf
“Green Impact Zone of Missouri Year One Annual Report: Visual Transformation.” 2012. Accessed August 24, 2020 from http://greenimpactzone.org/assets/2012annualreport.pdf
“California Environmental Justice Alliance.” n.d. “About Green Zones.” Accessed August 27, 2020 from https://calgreenzones.org/wp-content/uploads/2019/10/ENGLISH-Green-Zones-handout-2019-1.pdf
Cunningham, Gary, Calvin Hawkins, Judith Hall, Dawn Hawkins-Nixon, Sacoby Wilson, Kamita Gray, & Akosua Dosu. 2018. “Prince George’s County Environmental Justice Commission.” (pp. 14-15, Rep.).